CF-FireLogger

CF-FireLogger is a ColdFusion server-side library for the FireLogger Firebug extension. It enables logging of information from within ColdFusion code directly to the Firebug/FireLogger console. An optional feature allows viewing of ColdFusions debugging information in the console instaed of inline. CF-FireLogger is a great debugging tool for any situation, and is especially useful for "AJAX" style applications where showing debug info inline isn't always an option. CF-FireLogger can be used as a standalone feature, or integrated with CFs built-in cftrace/trace() commands.
CF-FireLogger Home (this page)
CF-FireLogger on github (download, issue tracking, Wiki)
CF-FireLogger on RIA Forge (alternate issue tracking)
Current version: 2.1.2 (Jan-28-2012)
> License
> Contributors
> Requirements
> Download & Installation
> Usage
> Settings
> Limitations
> Special Instructions for JBoss
> CFC Documentation
License
Copyright ©2012 Maxim Paperno. All right reserved.
Licensed under the Apache License, Version 2.0 (the "License"); you may not use this file except in compliance with the License. You may obtain a copy of the License at:
http://www.apache.org/licenses/LICENSE-2.0
Unless required by applicable law or agreed to in writing, software distributed under the License is distributed on an "AS IS" BASIS, WITHOUT WARRANTIES OR CONDITIONS OF ANY KIND, either express or implied. See the License for the specific language governing permissions and limitations under the License.
Contributors
CF-FireLogger is written and maintained by Maxim (Max) Paperno.
Parts of this code were based on the ColdFusion code used for the ColdFire project by Raymond Camden, Adam Podolnick, and Nathan Mische. Namely, the debug info logging, JSON serialization routines, and the custom trace.cfm tag are modified versions of the ones from ColdFire. Thanks guys!
Some credits from the original ColdFire documentation:
-Thank you to Thomas Messier for the use of his JSON code.
-Thank you to Sean Corfield for writing the JBoss documentation.
Requirements
CF-FireLogger works with Adobe ColdFusion version 9. Older versions are not supported at this time.
You will also need Firefox, Firebug, and FireLogger, as described in the Installation section below.
CF-FireLogger is compatible with the ColdFire debugger console in that it supports enhanced trace output for ColdFire.
Download & Installation
Firefox, Firebug, and FireLogger
CF-FireLogger provides output which is parsed by FireLogger which is an extension to Firebug, which in itself is an extension for the Firefox browser. This means you must have the following items installed:
- Firefox ( http://www.mozilla.org/firefox/ )
- Firebug extension ( http://www.getfirebug.com/ )
- FireLogger extension ( http://firelogger.binaryage.com/ )
CF-FireLogger
Download the latest version from Github.
- To install, first extract the .zip installation package to a folder on your computer.
- Move the "us" folder and its contents (/us/wdg/cf/firelogger.cfc) to your ColdFusion CustomTags directory. Typically (on Windows) this will be C:\ColdFusion9\CustomTags. Or you can place it anywhere else CF will know to look for custom tags and components (for example if you have specified additional custom tag paths in CF admin). You could also just place the firelogger.cfc file into your site's web root folder, although it is preferable to have it available where CF can always find it.
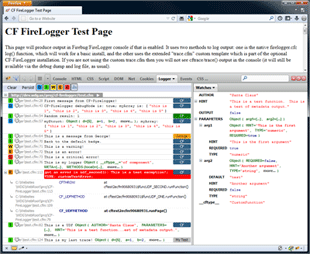
- To test CF-FireLogger, put the test.cfm and firelogger-test.cfc files somewhere you can run them from (in a site folder) and then load up test.cfm in Firefox. Make sure you have Firebug enabled for the current site, and make sure FireLogger is also enabled (use the little arrow next to the "Logger" tab). You should see output in the FireLogger window, similar to the screenshot above.
- You are ready to start utilizing the basic functions of CF-FireLogger by using firelogger.cfc directly (instructions below, or just read the test.cfm file). To integrate CF-FireLogger with CFs built-in cftrace/trace() commands (recommended!), keep reading.
Optional Installations and Files
While the firelogger.cfc provides most of the functionality, there are certain enhancements which require additional files.
Using the custom trace.cfm tag/function (recommended)
NOTE: This involves slightly altering your ColdFuison installation. Proceed with caution and be sure to backup all modified files!
CF-FireLogger provides the ability to log output to the console using the standard cftrace tag or trace() function. This is a huge benefit since your code will continue to run even if CF-FireLogger is not installed. So, for example, you can install CF-FireLogger just on your dev server and not worry about any left-over logging tags breaking your code when it's moved to production. The customized trace tag includes all the same functionality as the original one from Adobe.
The customized trace.cfm is also compatible with the ColdFire Firebug extension. If ColdFire is enabled and enhanced tracing is checked then trace.cfm logs rich trace output which ColdFire can display. On the other hand if firelogger.cfm is set as the debug handler (see below), then the output is logged in a format CF-FireLogger debug dump can display.
- To install this tag, find the WEB-INF/cftags folder under your ColdFusion web root folder.
- In this folder there should be a template named trace.cfm. Rename it to trace_adobe.cfm.
- Now copy the trace.cfm file, found in the /cftags folder of the installation package, to the WEB-INF/cftags folder.
Logging CF Debug Output to FireLogger
Another optional CF-FireLogger feature is directing CFs built-in debugging info dump to the FireLogger console. This prevents the information from interfering with your page display and makes it possible to debug "background" requests like in AJAX-based applications. It also makes a LOT more information available than the standard debug output options because you can drill down into any complex object like structures, queries, components, etc. You can view results of queries (not just the SQL statement), and the actual values of complex variables (instead of just "Struct(4)" like the built-in versions give you).
- To install, find your ColdFusion web root directory. Typically (on Windows) this will be C:\ColdFusion9\wwwroot.
- There should be a folder in this directory called WEB-INF. Find the WEB-INF/debug folder. It should have some files like classic.cfm and dockable.cfm in it.
- Copy the firelogger.cfm template located in the /debug folder of the installation package to this WEB-INF/debug folder.
- Go to your ColdFusion Administrator, enable debugging, and select "firelogger.cfm" from the Select Debugging Output Format option drop down. Ensure your IP is listed or that there is no IP restriction in place.
- You can control what information is going to be logged to FireLogger using the options on the CF admin page, just like you would for the built-in debugging templates.
- Open the FireLogger preferences dialog (use the little arrow next to the "Logger" tab) and select the checkbox next to "Enable server-side profiling and call graph." Never mind the actual wording of that setting. What it does is tell CF-FireLogger to show the debug output, or not. This is a convenient method of enabling or disabling debug output without having to go to the CF admin page each time.
Once you have done that you should then be able to view ColdFusion debug information from within the Logger tab in the Firebug tool. Obviously you need to hit a ColdFusion page to see the debugging information.
Although not required, the debugging output can make use of the custom trace.cfm tag (described above) to log enhanced information to the debug output. When using the cftrace/trace() commands, the enhanced tracing feature provides much richer detail in the debug output than CF's built-in variable dump. Specifically, you can drill down into any complex object, like structures, queries, components, etc. Typical CF trace logging just shows you what type of complex variable you have logged, and maybe its length (not very useful!).
Note Regarding Variable Output with Applications Using OnRequest()
When used for debuging output as described above, CF-FireLogger provides a way to dump your "variables" scoped variables in the output (see "Usage," below).
If your application uses the onRequest method of Application.cfc then the "variables" scope is local to your application and cannot be accessed by the firelogger.cfm debug template. To get around this, you have 2 options:
- Copy your variables scope into the request scope for debugging. Eg. <cfset request.my_vars_scope = variables>
- Extend the Application.cfc component provided with this project. Note that if your application uses onRequestEnd then you must call super.onRequestEnd() as part of your application's onRequestEnd method. The Application.cfc component is provided in the /appcfc folder of the CF-FireLogger installation package. This essetially does the same thing by copying your local variables scope into the request scope, into a structure named "__cfc-variables-scope__" So, for example, if you log "variables.myVar" it will appear in the output as "request.__cfc-variables-scope__.myVar".
Usage
Using CF-FireLogger is very simple. The best place to start would be to check out the included test.cfm file and see what is possible. It shows how to use the firelogger.cfc component directly as well as how to use it with cftrace/trace() commands.
If you opted to install the custom cftrace.cfm file, you can simply use cftrace/trace() as specified in the CF documentation. For example:
<cftrace var="myVariableName" text="My message to log"> or
trace("myVariableName"); or
trace("myVariableName", "My message to log", "warning");
All attributes of the cfcatch tag are supported and the syntax is exactly the same. You don't need to do anything else to use cftrace/trace(), which is why it is the recommended method.
Using the firelogger.cfc compnenet directly does provide some extra flexibility, however, or perhaps changing your server configuration isn't an option. Here's a summary of how to use it. I'll use CFML tag syntax for the examples, but of course you can use cfscript syntax as well. Assume myVariableName is some kind of "complex" value like a structure or query.
- First you need to instantiate and intialize the component.
<set console = new firelogger()> or
<cfset console = CreateObject("component", "firelogger").init()> or (to avoid naming conflicts)
<set console = new us.wdg.cf.firelogger()> - Now you can simply call console.log() to send output to the console. Just like JavaScript :)
<cfset console.log(myVariableName)> or
<cfset console.log("Some message to log")> or
<cfset console.log("Some message to log with a #simpleVariable#")> or
<cfset console.log("Some message to log", myVariableName)> or
<cfset console.info("Information type message to log")> or
<cfset console.warn("Warning type message to log")> and so on...
Note that you pass variables by value, unlike cftrace where you pass variables by name. The log() method acts more like the cfdump tag, to which you also pass variables by value. It's a small, but important, distinction.
If you pass an error object to log() or trace() then it will automatically format all the available error information for you and include a CF stack trace (technically, the "tag context") in the output. So for example:
try { /* done some fancy stuff */ }
catch (any e) { trace("e"); }
This will dump all the error info to the FireLogger window if it is enabled, or log it to the CF debug info and log file if it is not (default trace behavior).
CF-FireLogger reports internal errors in a similar manner. Internal errors will appears at the top of any other log messages. Please copy/paste this info, including the stack trace, when reporting errors!
Optional password protection
The FireLogger extension provides a way to specify a password which is sent to the server to enable debug output. By default no password is required. This may possibly expose sensitive information if used on a site which is publicly-accessible. You can specify a password via several methods:
- Use a password attribute when initializing the firelogger.cfc component: <set console = new firelogger(password="mypass")>
- Edit firelogger.cfc and provide a default value for the variables.password declaration.
- To only enable password protection for CF debugging output, edit the debug/firelogger.cfm file and set the value for the __firelogger__.password variable.
Using a password, one could theoretically leave debugging enabled on the server w/out specifying an IP address and still have the information relatively secure. Could be useful for developing from dynamic IPs!
Settings
Firelogger.cfc
For all possible firelogger.cfc settings, see the Parameters section of the cfc docs. Most parameters can be set either at init() as name=value pairs, for example new firelogger(password="mypass"), or by using setter methods, for example firelogger.setPassword("mypass").
Custom Trace options
By default, the custom trace tag will log traces to the cftrace.log ColdFusion log file, just like the official version does. You can disable this behavior by edting the cftags/trace.cfm file and chaning one line:
<cfset doTrace(attributes, true)>
to
<cfset doTrace(attributes, false)>
CF Debugging Output Options
Note that if the Logger tab is not set to Enabled, then Firefox does not send the appropriate headers and the debug template (debug/firelogger.cfm) simply exits without doing anything. If you would like to fall back to using another debug template in such cases (such as classic.cfm or dockable.cfm), use the fallbackTemplate setting, described below.
Specifying variables to log:
By default only the variable scopes set to display in CF Administrator will be included in the output. This does NOT include the "variables" scope.
You can tell CF-FireLogger to include specific variables (or scopes) in the output by setting a special request variable to an array of values. For example, set this anywhere in your CF code:
<cfset request.firelogger_debug.varlist = ['variables.myVar','variables.myQuery']>
Or, to dump the whole "variables" scope:
<cfset request.firelogger_debug.varlist = ['variables']>
If you would like to limit the amount of information returned in the debug variables output (and speed up the process as well), you could, for example, disable all the scopes in the CF Admin debug settings, and then specify what you want dumped using the request array.
Other possible settings :
(These can all be found at the top of debug/firelogger.cfm)
fallbackDebugHandler (default: classic.cfm) - As mentioned below, CF-FireLogger can't send HTTP headers after output has already been sent to the browser. This can happen for a number of reasons, including if there is an unhandled exception in your code. Set the value of this variable to the debug template to use in such cases. Set it to blank to disable any fallback handler.
fallbackTemplate (default: blank) - If Firebug/FireLogger is not enabled, you can specify a template to use instead. For example "classic.cfm" or "dockable.cfm".
extraVarsToShow (default: empty array) - An array of variable scopes/names to always include in the output, regardless of CF Admin settings.
password (default: blank) - as mentioned above, you can set this to enable password protection for your debug output.
Limitations
CF-FireLogger makes use of HTTP headers to supply debug information to the browser. Because of this there are certain places where CF-FireLogger will not be able to work. First - if you use CFFLUSH anywhere on the page, CF-FireLogger is unable to add header information to the request after the flush. Similary, there are situations where certain tags will implicitly flush output. One example is CFTIMER/type="inline". Also, you cannot add headers to remote cfc calls after the requested method is invoked (ie. in OnRequstEnd or the debugging template).
CF Debugging Output Limitations & Performance
The CF debugging variables dump can only output variables available in the requested template. This means that variables local to components, custom tags, or UDFs cannot be displayed. If you would like to include those in the dump, you could copy them into a shared scope like request. For example: request.my_UDF_Local_Vars.myVar = local.myVar; Or simply: request.my_UDF_Local_Vars = local;
Dumping variables (especially whole scopes) can incur a significant performance penalty. Unlike the built-in CF debug output options, CF-FireLogger will drill down and display complex object types, which can take a significant amount of time in some cases. If you find your page requests taking a long time to process because of the debug output, you may want to limit what is being dumped by using the CF Admin options and/or the request.firelogger_debug.varlist as described in "Usage."
Similarly, keep in mind that the communication with FireLogger happens via HTTP headers by passing Base64-encoded JSON strings. Depending on how much you're dumping, this could get very large. It takes time to build the headers, transmit/receive them, and then parse them on the client. So, the more you have, the slower things will get.
The total CF debug output time is available as an HTTP header which you can examine in Firebug's Net panel (CF-FireLogger-debug-time). This includes parsing the data and building the headers. There is also a debug time available in the General Info view-- this is just the time it took to parse the data.
As noted in the previous section, dumping any "variables" scoped variables will not work for applications using the onRequest method of Application.cfc unless the variables scope is copied to a shared scope like request first, or your Application.cfc extends the CF-FireLogger Application component.
Special Instructions for JBoss
(Thank you to Sean Corfield for writing this JBoss documentation for the ColdFire project.)
JBoss has a default maximum HTTP header size of 4Kb in total. You can modify it by editing the following file:
{jbossdir}/server/{servername}/deploy/jbossweb-tomcat55.sar/server.xml
You need to add (or modify) the maxHttpHeaderSize to allow larger packets. Here's the top portion of a modified server.xml file (set to allow 64Kb total headers so it still won't allow giant swathes of execution time reports but it should cover most cases).
<Server>
<!--
Use a custom version of StandardService that allows the connectors
to be started independent of the normal lifecycle start to allow
web apps to be deployed before starting the connectors.
-->
<Service
name="jboss.web"
className="org.jboss.web.tomcat.tc5.StandardService">
<!-- A HTTP/1.1 Connector on port 8080 -->
<Connector
port="8080"
address="${jboss.bind.address}"
maxThreads="250"
strategy="ms"
maxHttpHeaderSize="65536"
emptySessionPath="true"
enableLookups="false"
redirectPort="8443"
acceptCount="100"
connectionTimeout="20000"
disableUploadTimeout="true" />